SaaS Cash Flow Forecast Template
Built around monthly and annual subscriptions, churn, collection timing and runway, the numbers boards and investors ask about first. Pre-built with the cash lines, scenarios and dashboard saas owners need.
- Forecast views
- 13-week, 12-month, 3-year
- Works in
- Excel, Google Sheets
- Built for
- SaaS
$49
This template is in its final checks. Leave your email and we’ll send it the day it’s ready, with a launch discount.
Inside the template
What’s inside
- 13-week weekly forecast linked to a 12-month monthly view and 3-year outlook
- Cash in lines ready to use: Monthly subscriptions, Annual prepaid plans, Implementation fees, Investment rounds
- Cash out lines ready to use: Engineering payroll, Cloud infrastructure, Sales commissions, Paid acquisition
- Best, expected and worst case scenarios with one switch
- Actual vs forecast tracker with variance highlighting
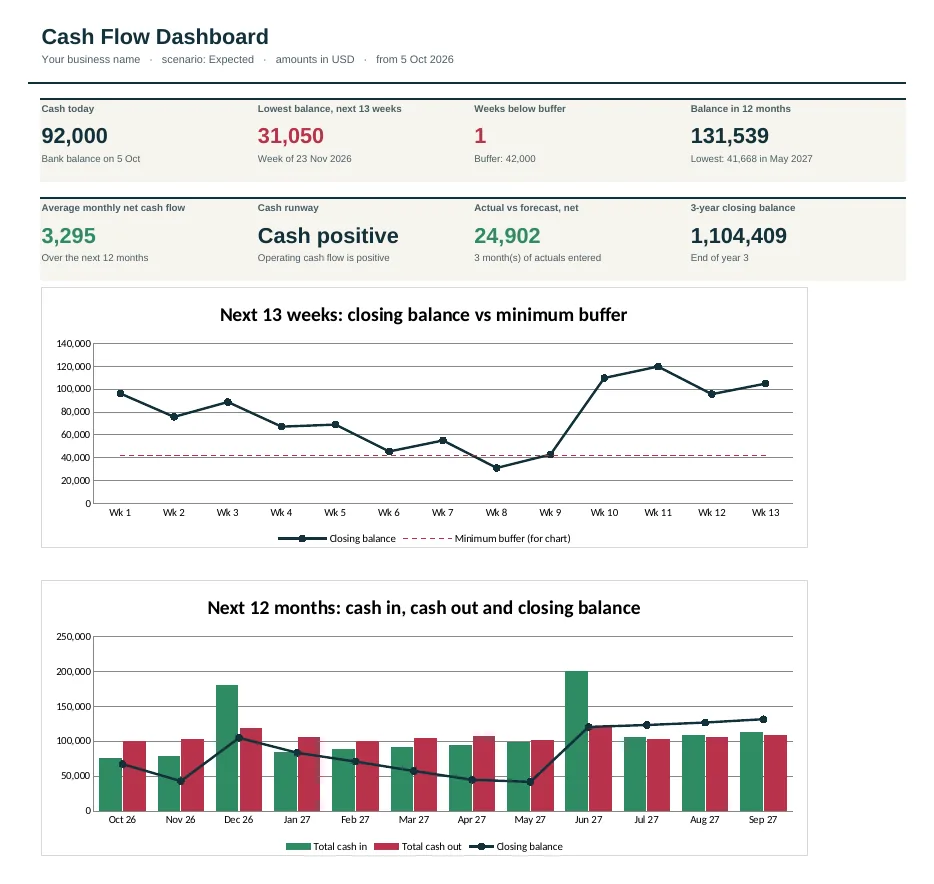
- Dashboard: lowest balance, runway, buffer alerts and charts
- Loan, tax and one-off payment schedules
- Start-here tab with a filled-in SaaS example
- Excel (.xlsx) and Google Sheets versions
Who it’s for
Built around monthly and annual subscriptions, churn, collection timing and runway, the numbers boards and investors ask about first. The template is built for owners, managers and bookkeepers of saas businesses who want a forecast that already speaks their language, rather than a generic spreadsheet they have to rebuild.
What’s inside
- Start Here: setup steps, colour key and a guide to every tab.
- Dashboard: cash today, the lowest balance in the next 13 weeks and 12 months, weeks below your buffer, runway, actual vs forecast and two charts.
- Settings: start date, bank balance, minimum buffer, currency, the expected / best / worst case switch and 3-year growth rates.
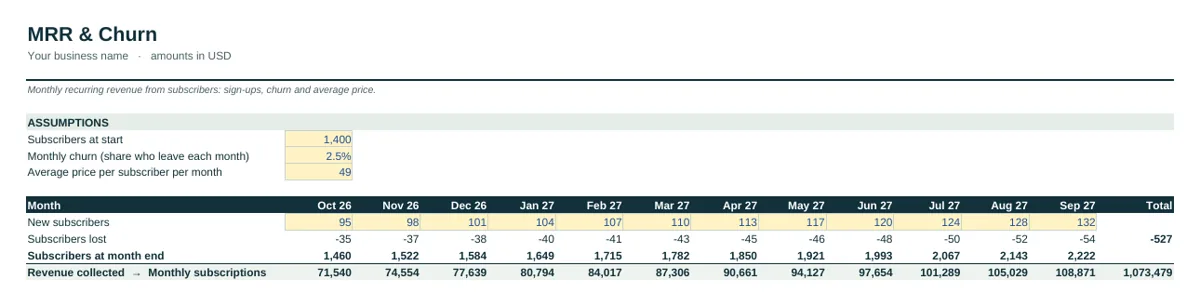
- MRR & Churn: monthly recurring revenue from subscribers: sign-ups, churn and average price.
- Revenue-Linked Costs: costs that rise and fall with sales, worked out as a percentage of the sales lines on the 12-Month tab.
- Runway: monthly burn, months of runway and the latest date to start raising, read from the 12-Month tab.
- 13-Week: weekly receipts and payments for the next quarter, with automatic week dates and buffer warnings.
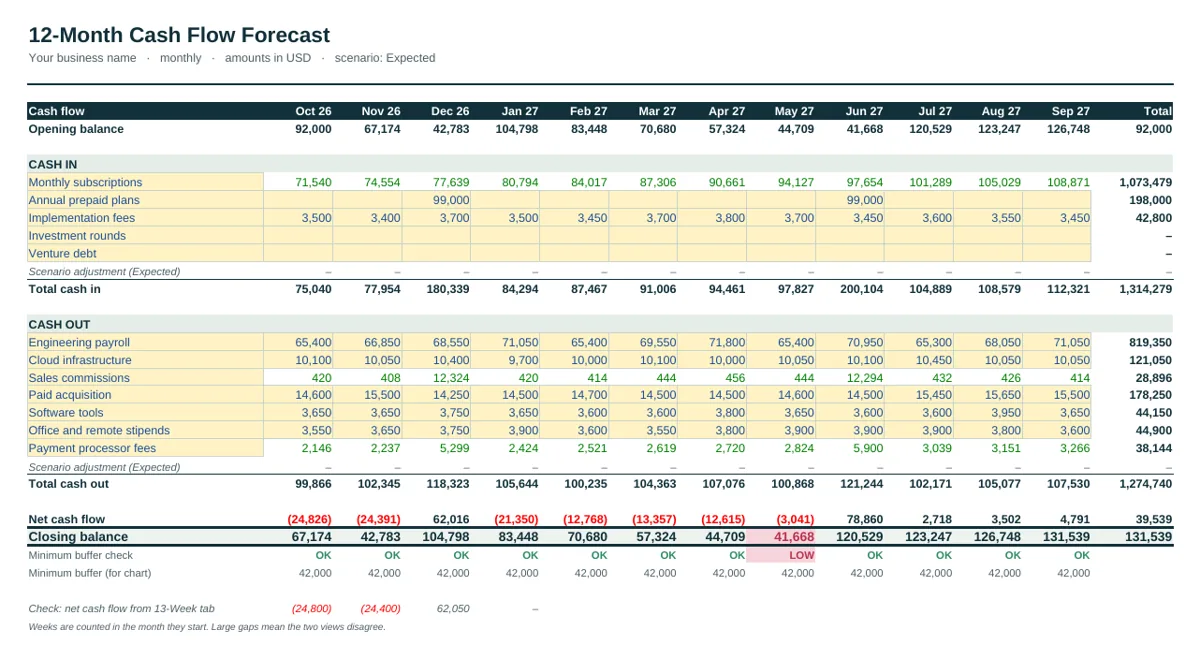
- 12-Month: the monthly forecast for the year, with a check row that compares it with the 13-week view.
- 3-Year: an annual outlook built from the 12-month forecast and your growth rates.
- Actuals: what really happened each month, typed in from your bank statement or accounts.
- Variance: actual minus forecast for every line, in green and red, with year-to-date totals.
How the MRR & Churn tab works
The MRR & Churn tab builds “Monthly subscriptions” from subscribers: 1,400 at the start, new subscribers each month, 2.5% leaving each month and an average of $49 per subscriber per month. It shows subscribers lost, subscribers at month end and revenue, so you can see exactly what a change in churn is worth.
The Revenue-Linked Costs tab calculates sales commissions at 12% of annual prepaid plans and implementation fees and payment processor fees at 3% of monthly subscriptions and annual prepaid plans. Change a percentage once and every month of the forecast updates, so costs rise and fall with the sales that drive them.
The Runway tab reads the 12-Month forecast and shows operating burn excluding funding, months of runway left at each month end, the month cash runs out and the latest month to start raising, allowing 6 months to close a round.
Green numbers on the 12-Month tab come from these calculations. You can change the assumptions on the tab, or type over a green cell if you’d rather enter a figure yourself.
Cash lines already in place
Cash in: monthly subscriptions, annual prepaid plans, implementation fees, investment rounds and venture debt. Cash out: engineering payroll, cloud infrastructure, sales commissions, paid acquisition, software tools, office and remote stipends and payment processor fees. Rename any line, or insert a row inside a section and the totals include it.
Set up in about 20 minutes
- On Settings, enter the start date, today’s bank balance and your minimum cash buffer.
- On the MRR & Churn tab, replace the example assumptions with your own.
- Enter the remaining cash in and cash out lines on the 12-Month and 13-Week tabs, in the period each amount actually moves.
- Check the Dashboard for your lowest balance and any red weeks or months.
- At each month end, type actual figures on the Actuals tab and review the Variance tab.
Excel, Google Sheets and delivery
The workbook is a standard .xlsx file with no macros or external links, tested in Excel and Google Sheets. After payment you get an instant download link on screen and by email, plus a quick-start PDF. For background on the method, read the SaaS cash flow guide or how to make a cash flow forecast.
Questions people ask
Do I need accounting experience?
No. You enter numbers in clearly marked cells. The instructions tab walks through a filled-in example first.
Can I change the categories?
Yes. Rename, add or delete lines. Totals and charts update automatically.
What do I receive after buying?
An instant download link by email with the Excel file and a Google Sheets copy link.
Is there a refund?
If the template doesn’t fit your business, email us within 14 days for a refund.